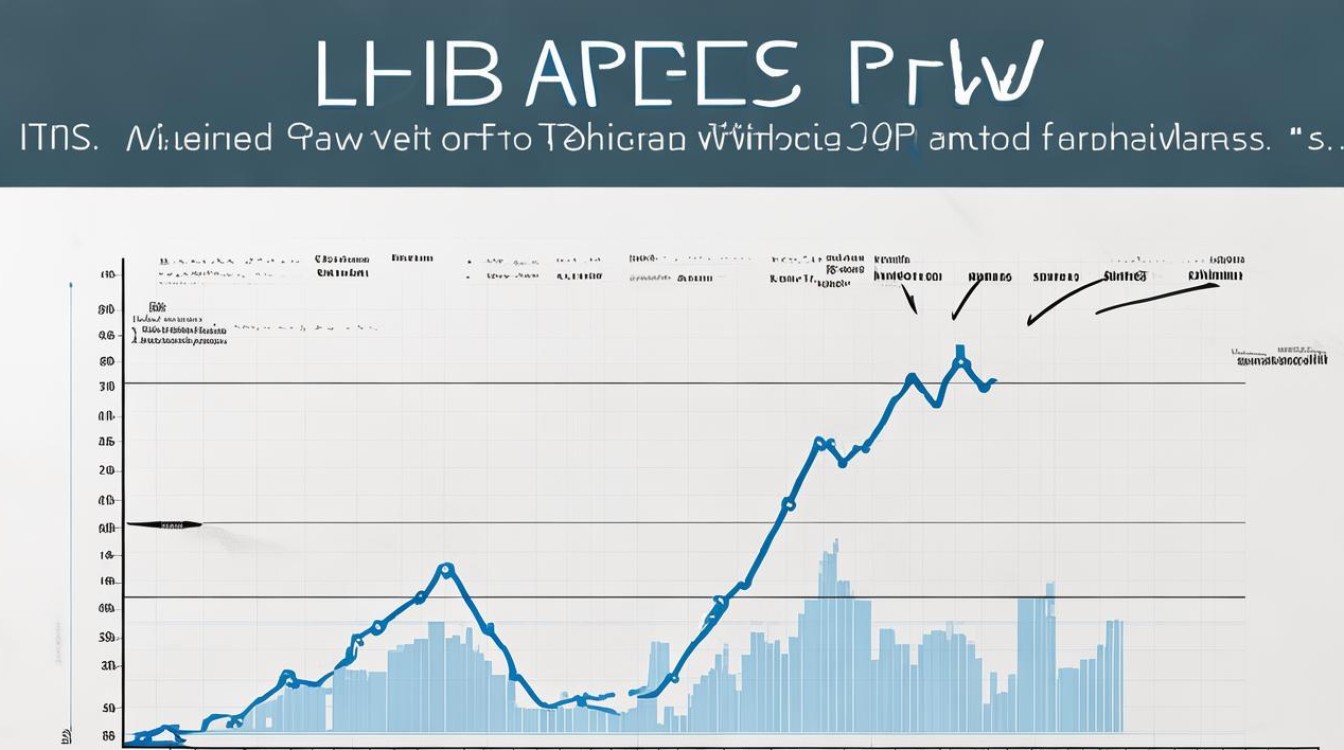
雅思写作Task 1中,线状图(Line Graph)是常见题型之一,这类题目要求考生在20分钟内完成150字以上的描述,准确呈现数据趋势、比较关键信息,并避免主观评论,掌握线状图的写作方法,能帮助考生在考试中高效得分。

线状图的核心写作逻辑
线状图的本质是展示数据随时间变化的趋势,因此写作重点应放在:
- 趋势描述(上升、下降、波动、稳定)
- 数据对比(最高点、最低点、交叉点)
- 关键细节(起点、终点、转折点)
避免机械罗列数字,而应通过合理分组和对比,让阅卷人快速抓住核心信息。
四段式结构:清晰高效的写作框架
第一段:引言(Introduction)
用1-2句话改写题目,说明图表展示的内容,避免直接照抄题目,可替换同义词或调整句式。
例句:

- 原题:The graph below shows the changes in the number of international students in three countries from 2000 to 2020.
- 改写:The line graph illustrates how the population of overseas students in three nations varied over two decades, starting in 2000.
第二段:概述(Overview)
用2-3句话概括图表最显著的特征,无需具体数据,通常包括:
- 整体趋势(如总体上升/下降)
- 关键对比(如某条线始终最高)
- 异常现象(如某时间段剧烈波动)
例句:
"Overall, all three countries experienced growth in international student numbers, though at different rates. Country A consistently had the highest figures, while Country C showed the most dramatic surge after 2010."
第三段 & 第四段:细节段(Details)
将数据分成两组,每段描述2-3条线的变化,分段逻辑可以是:
- 按趋势相似性分组
- 按数值高低分组
- 按时间段分组
写作技巧:

- 时间状语:In 2005, By 2010, Over the first decade...
- 趋势动词:climb, plummet, fluctuate, stabilize
- 程度副词:sharply, gradually, marginally
- 数据引用:peaking at 2 million, hitting a low of 500,000
例句:
"From 2000 to 2008, Country A's student population rose steadily from 1 million to 1.7 million, whereas Country B saw slower growth, reaching just 800,000 by 2008. However, both nations experienced a brief dip in 2009 due to the global financial crisis."
避免五大常见错误
- 主观猜测原因:线状图只需描述数据,不要写"because of economic growth"等推测。
- 遗漏关键数据:必须包含起点、终点、最高/低点等核心信息。
- 时态混乱:过去时间段用一般过去时,未来预测用将来时。
- 过度简化:只说"increased"而不说明幅度(如surged by 50%)。
- 机械翻译:避免中式英语,如"quickly grow"应改为"grow rapidly"。
高分同义词替换
| 基础词汇 | 高分替换 |
|---|---|
| Increase | Surge, soar, climb |
| Decrease | Plummet, plunge, dip |
| Big | Significant, substantial |
| Small | Marginal, modest |
| Show | Illustrate, depict |
实战案例解析
** The graph shows electricity production from renewable sources in four European countries (2000-2020).
范文节选:
"The line graph compares renewable energy output in Germany, France, Spain, and Italy over a 20-year period. Overall, all nations increased their production, with Germany leading throughout.
Germany's generation rose sharply from 50 TWh in 2000 to 180 TWh by 2020, despite minor fluctuations after 2015. Similarly, Spain tripled its output from 20 TWh to 60 TWh, overtaking Italy in 2012. In contrast, France and Italy showed steadier growth, both ending at around 40 TWh."

个人观点
线状图写作的核心在于逻辑分组和精准表达,平时练习时可多分析官方范文,注意其数据选取和段落划分,建议用10分钟观察图表、5分钟写作、5分钟检查,确保动词时态、数据准确性和趋势用词多样性。

