Linear graphs are one of the most fundamental tools in data visualization. Whether you're a student, a business professional, or just someone curious about trends, understanding how to read and create linear graphs is essential. This guide will walk you through the basics, applications, and best practices for using linear graphs effectively.

What Is a Linear Graph?
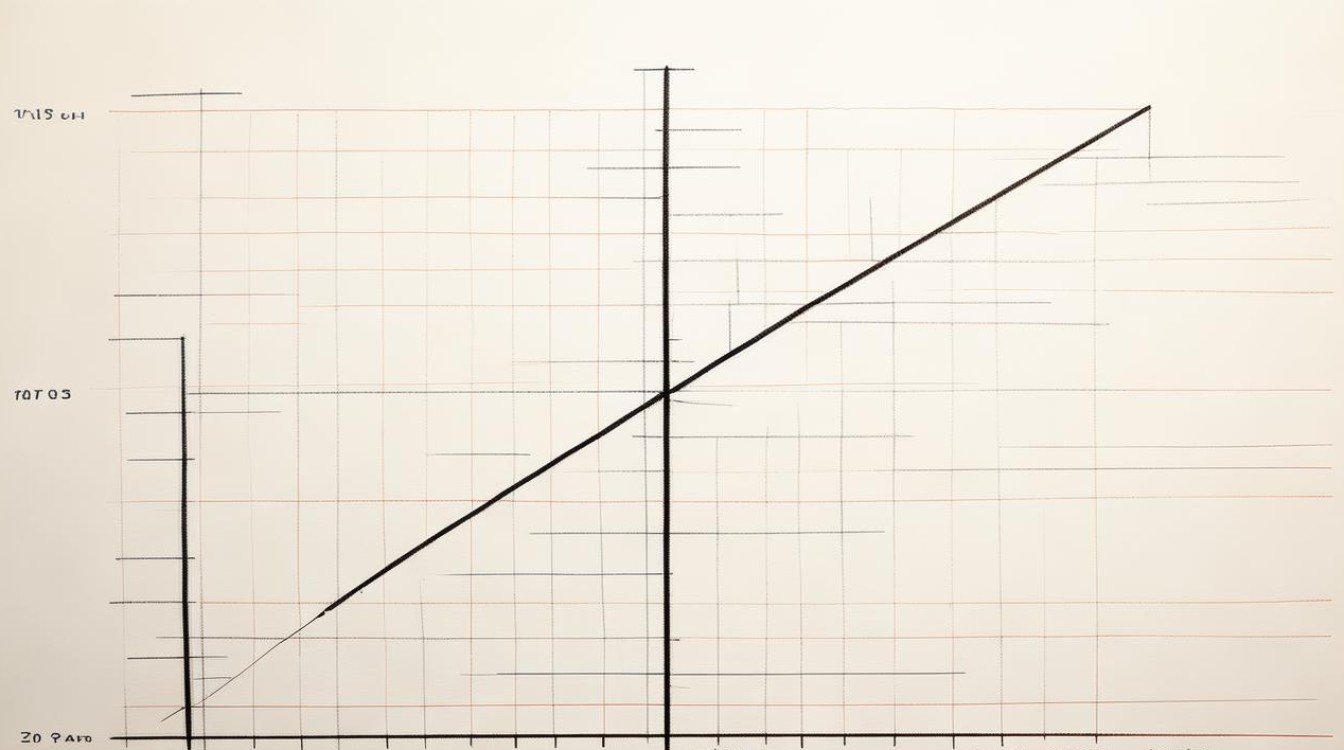
A linear graph, also known as a line graph, displays data points connected by straight lines. It shows how values change over time or across different categories. The horizontal axis (x-axis) typically represents time or independent variables, while the vertical axis (y-axis) shows dependent variables.
For example, if you track monthly sales, the x-axis could list months, and the y-axis would display revenue. Connecting these points with lines makes trends easy to spot.
Why Use Linear Graphs?
- Trend Identification – Linear graphs highlight increases, decreases, or stability in data. Businesses use them to track sales, economists analyze GDP growth, and scientists observe temperature changes.
- Comparison – Multiple lines on the same graph allow easy comparison between different datasets. A retailer might compare sales of two products over a year.
- Simplicity – Unlike complex charts, linear graphs are intuitive. Even non-experts can quickly grasp the information presented.
How to Create a Linear Graph
Creating a linear graph involves a few key steps:

- Gather Data – Ensure your data is organized. If tracking temperature over days, list dates and corresponding temperatures.
- Choose Axes – Decide what goes on the x-axis (time, categories) and y-axis (measured values).
- Plot Points – Mark each data point where the x and y values intersect.
- Connect the Dots – Draw straight lines between points to visualize trends.
- Label Clearly – Always include axis labels, a title, and a legend if multiple lines are present.
Common Mistakes to Avoid
- Overcrowding – Too many lines make the graph confusing. Stick to 3-4 datasets max.
- Missing Labels – Unlabeled axes render the graph meaningless. Always define what each axis represents.
- Inconsistent Scales – If comparing graphs, use the same scale for accurate analysis.
Real-World Applications
- Finance – Investors use linear graphs to track stock prices over time. A rising line indicates growth, while a drop signals decline.
- Healthcare – Doctors monitor patient vitals like heart rate during recovery. Sudden spikes or dips are easily spotted.
- Education – Teachers plot test scores to identify student progress or areas needing improvement.
Enhancing Your Linear Graphs
To make your graphs more impactful:
- Use Color Wisely – Differentiate lines with distinct colors but avoid overly bright combinations.
- Add Annotations – Highlight key events, like a product launch affecting sales.
- Keep It Clean – Remove unnecessary gridlines or decorations that distract from the data.
Linear Graphs vs. Other Charts
While linear graphs excel at showing trends, other charts serve different purposes:
- Bar Graphs – Best for comparing categories (e.g., sales by region).
- Pie Charts – Show proportions (e.g., market share percentages).
- Scatter Plots – Reveal relationships between two variables (e.g., height vs. weight).
Choosing the right chart depends on your data and what story you want to tell.

Tools for Creating Linear Graphs
You don’t need advanced skills to make professional linear graphs. Several tools can help:
- Microsoft Excel – Simple and widely used for basic graphs.
- Google Sheets – Free alternative with similar functionality.
- Tableau – Powerful for complex data visualization.
- Python (Matplotlib) – Ideal for custom, programmatic graph creation.
Final Thoughts
Linear graphs remain a cornerstone of data analysis because of their clarity and versatility. Whether you're presenting business metrics, scientific data, or personal projects, mastering them ensures your information is communicated effectively. The next time you encounter a dataset, consider how a linear graph could reveal insights that raw numbers alone might hide.
By integrating these techniques, you’ll create graphs that are not only informative but also engaging for your audience.


