在雅思写作考试中,柱状图(Bar Chart)是常见题型之一,尤其涉及学科对比时,考生需要准确描述数据差异并分析趋势,本文以文科(Arts)和理科(Science)的柱状图为例,解析如何高效组织文章结构、选取关键数据,并提升逻辑表达能力。

柱状图的核心特征
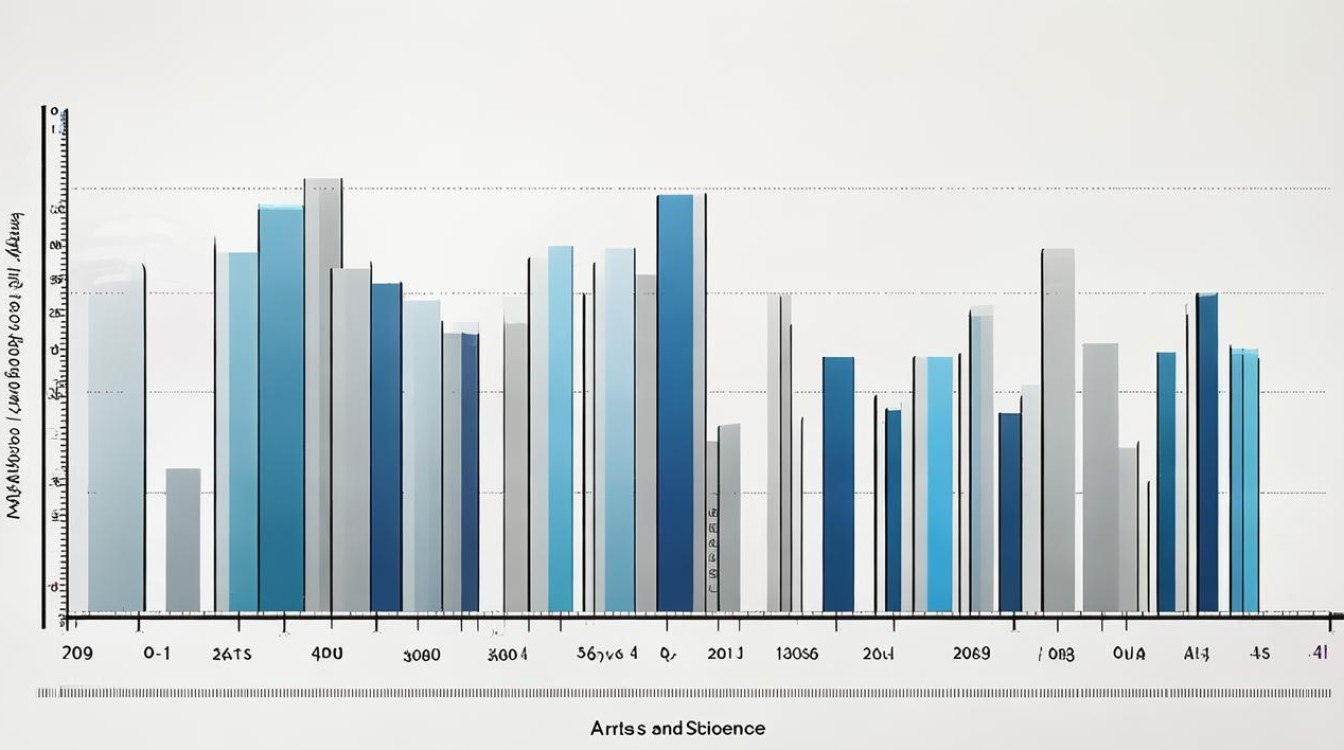
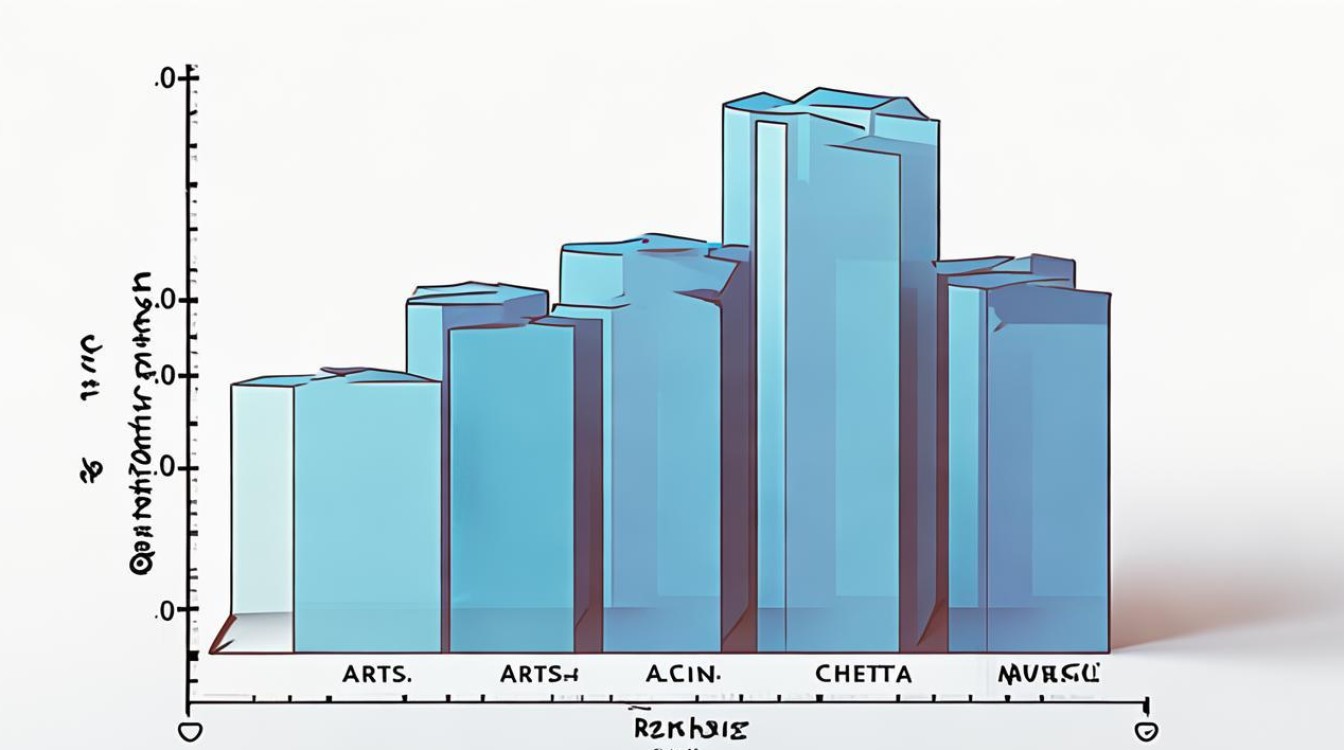
柱状图通过不同高度的柱子直观展示数据差异,在分析文科与理科数据时,需重点关注以下要素:
- 横纵坐标含义:横轴通常为学科分类(如文科、理科或细分领域),纵轴表示数值(如学生人数、就业率、研究经费等)。
- 数据极值:最高与最低的柱子往往反映显著差异,理科生人数可能显著高于文科,或文科的增长率更突出。
- 时间变化:若图表包含多年度数据,需对比趋势变化,如“理科占比五年内上升20%”。
高分写作结构示范
引言段(Introduction)
开门见山说明图表内容,避免冗长。
The bar chart compares the proportion of students enrolled in arts and science disciplines across three universities between 2015 and 2020.
主体段1(关键数据描述)
选取最显著的数据进行对比,使用连接词强化逻辑:
- 理科优势:若理科数据更高,可写:“Science departments dominated, with University A recording 65% science students in 2020, nearly double the arts cohort.”
- 文科趋势:若文科增长快,可强调:“Arts enrollments surged by 15% at University C, while science figures remained stable.”
主体段2(细节与例外)
补充次要数据或例外情况,展现全面分析能力:

Despite the overall preference for science, University B showed a unique pattern: arts students outnumbered science learners by 10% in 2018, possibly due to its renowned literature program.
结尾段(核心观点)
避免简单重复数据,转而提出合理推断或影响:
The data suggests a stronger societal emphasis on science education, though arts fields retain niche appeal in specific institutions. Policymakers could address this imbalance by promoting interdisciplinary programs.
语言技巧提升
-
多样化表达:
- 上升:increase / rise / climb / surge
- 下降:decline / drop / dip / plummet
- 占比:account for / represent / constitute
-
数据引用精准化:

- 模糊表述(低分):Many students chose science.
- 精准表述(高分):Over 70% of applicants opted for science majors, peaking at 75% in 2019.
-
比较句型:
- While science enrollments doubled, arts figures grew marginally by 5%.
- University A’s science intake was three times higher than that of University B.
常见误区与纠正
- 机械罗列数据:避免逐条描述柱子,应分组对比(如“所有大学的理科数据均高于文科”)。
- 忽略单位:若纵轴为“千人”,需写明“5,000 students”而非仅“5”。
- 时态错误:过去数据用一般过去时(The number rose),预测趋势用将来时(The gap will likely widen)。
实战案例分析
假设图表显示2015-2020年英美学生文理科选择比例:
-
英国数据:理科生占比从55%升至62%,文科从45%降至38%。
描述:“In the UK, science subjects gained 7% popularity over five years, whereas arts saw a corresponding decline.”
-
美国数据:文科稳定在50%左右,理科小幅波动。

分析:“The US maintained a balance between the two fields, with arts consistently attracting half of all students.”
这种跨地区对比能体现分析深度,建议考生在时间允许时加入。
个人观点
柱状图题型的核心并非复杂词汇,而是清晰的数据筛选与逻辑串联,考生应优先保证准确性,再追求句式多样性,对于文科与理科的对比,除了描述数字,还可适度关联社会背景(如科技行业需求推动理科增长),但需避免主观臆测。
本文数据仅为示例,实际写作需严格遵循题目信息,练习时建议使用《剑桥雅思真题》中的图表,针对性提升分析速度与表达流畅度。

